The Correlogram functionality automates the statistical analysis of serial correlation, model order identification, and exploratory patterns in a data sample.
Process
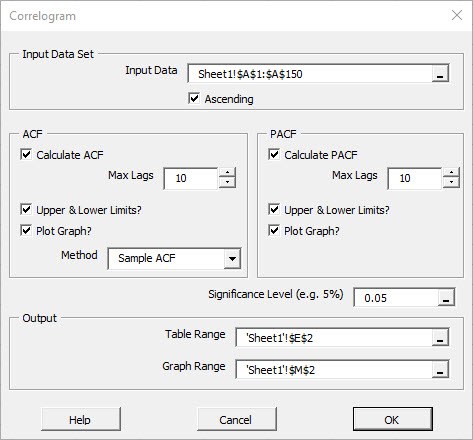
To use this functionality, select the corresponding icon on the toolbar (or the menu item).
![]()
Point to the data sample on your worksheet, select the maximum number of lags for both ACF and PACF analysis, choose a table and/or graph presentation, and designate a location on your sheet to print the ACF/PACF tables and the Correlogram graph.
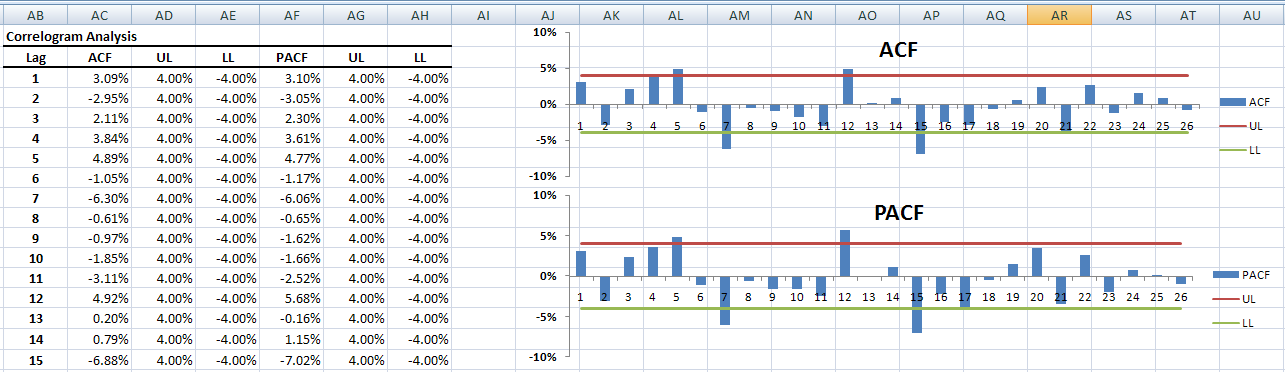
Output
Upon completion, the function outputs the ACF/PACF along with confidence limits (if selected) as formulas (instead of raw numbers) in the designated location of your worksheet
Comments
Article is closed for comments.